The Complete Tableau Bootcamp for Data Visualization

Master Tableau by Building Worksheets and Creating Professional Dashboards. Tableau Version 10 (2019).

4.59 (6264 reviews)
Udemy
platform
English
language
Data & Analytics
category
instructor
The Complete Tableau Bootcamp for Data Visualization
34,395
students
13 hours
content
Apr 2023
last update
$139.99
regular price

What you will learn

Learn the Foundational Elements of Data Visualization, and Apply Them Using Tableau

Build Professional Business Dashboards to Effectively Convey Patterns and Trends in Your Data

Learn and Master Level of Detail (LOD) Expressions to Solve Complex Tasks in Data Visualization

Learn and Master the Usage of Basic Calculations to Solve Common Tasks in Data Visualization

Learn and Master Table Calculations to Apply Further Transformations to Your Visualization

Learn to Navigate the Dashboard Workspace, and Customize Your Dashboards to Different Devices

Learn and Master Tableau’s Mapping Functionality to Answer Spatial Questions

Learn to Style and Format Maps with Mapbox, WMS, and Dual Axis capabilities

Learn to Find, and Make of Use of Various Spatial Files in Tableau

Learn and Master the Usage of Context Filters, Dimension Filters, Top N Filters, and Measure Filters.

Use Heat Maps to Find Hot Spots in Overlapping Data

Learn to Add Interactivity to your Plots using Set actions and Parameter Control

Learn about Different Join types to Combine your Data into a Single Rich Data Source

Learn to Use Story Points to Tell Stories With Your Data

Apply Pivots to your Data for Effective Data Processing

Implement Unions to Combine Multiple Data Sources into One

Learn About Theoretical Concepts Such as Data Types and Pre-attentive Processing

Why take this course?

Welcome to the best online resource for learning about Tableau!

This course will teach you everything you need to know to create amazing data visualizations and dashboards with Tableau!

Every module of this course is carefully designed to teach you what you need to know to create amazing data visualizations and dashboards with Tableau. We start with the basics and gradually build up your Tableau skill set by leveraging awesome real world data sets to create visualizations for your portfolio of projects.

Upon completing this course you will be ready to tackle your own data projects with real world data sets and create Tableau dashboards to show off to your colleagues or even potential employers. Completion of this course also includes a certification you can post to your LinkedIn profile!

Inside the course we'll cover:

  • Installing and setting up Tableau Public on your computer

  • Visual Analytics with Tableau

  • Tableau Mapping for Geographical Data

  • Basic Calculations

  • Table Calculations

  • Level of Detail (LOD) Expressions

  • Joins and Unions

  • Interactive Worksheets with Set Actions and Parameter Control

  • Spatial Mapping

  • Understanding Color Vision Deficiency

  • Build Sophisticated Dashboards and Unique, Engaging Stories through the Power of Data Visualization

  • and much, much more!

Not only do you get great technical content, but you will also get access to our Question and Answer Forums, where you and other students can get help on the course material and content.

All of this comes with a 30-day money back guarantee so you can enroll today completely risk free!

We'll see you inside the course!

Screenshots

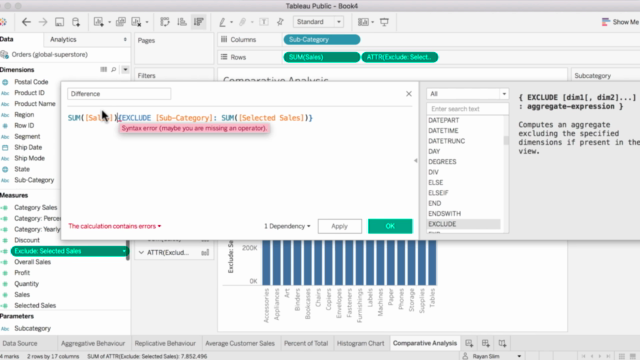
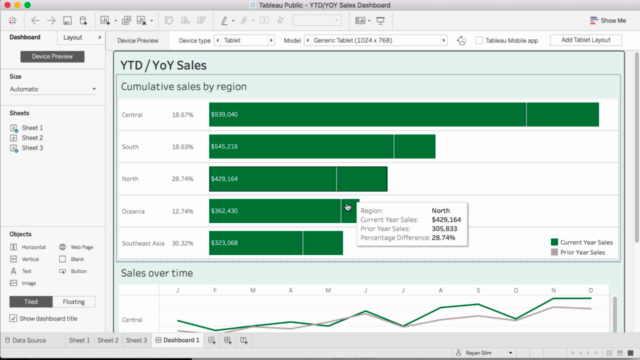
The Complete Tableau Bootcamp for Data Visualization - Screenshot_01The Complete Tableau Bootcamp for Data Visualization - Screenshot_02The Complete Tableau Bootcamp for Data Visualization - Screenshot_03The Complete Tableau Bootcamp for Data Visualization - Screenshot_04

Reviews

Ambry
April 13, 2024
This was an expected course for us to learn for an online college MS program and although it was a lot of information, I think this will give us an edge in applying for jobs in the future. I like that it is a step-by-step lesson.
DA
April 3, 2024
1.Connect to Data: Get your data into Tableau from different sources like Excel or databases. 2.Make Charts and Graphs: Create visuals like bar charts, line graphs, and maps by dragging and dropping. 3.Play with Data: Slice and dice your data using filters and calculations to focus on what matters. 4.Build Dashboards: Combine your visuals into interactive dashboards to tell a story. 5.Share Your Work: Share your insights easily with others using Tableau Server or Online. Throughout the tutorial, you'll pick up tips on how to make your visuals look great and tell a clear story with your data.
Devraj
March 27, 2024
The course is really interesting. It provides a lot of insights in regard to tableau. I really enjoyed it, and learned a lot. Thank you for providing such a wonderful course.
Katina
March 10, 2024
The instructor provided a lot of knowledge on tableau. It is a great beginner’s course for how to use the software. There are a lot of practical applications of the knowledge and skills that are learned in the course. He is not super engaging but it is very beneficial and knowledgeable.
Yves
February 27, 2024
Everything looks so obvious for the coach, not motivating. Exercise so badly explained for a non-English speaker
Jen
February 11, 2024
I was following the directions exactly from the video and ran into an error. I reached out to both Rayan the instructor as well as Q&A forum and got no assistance and could not move forward in the class
Bimal
January 23, 2024
I have been using Tableau for a while now, and I must admit that the course has exceeded my expectations.
Deborah
January 18, 2024
just beginning to learn about it so my knowledge is very litlle about it-- but willing to learn and see.
GBPI
December 16, 2023
Great match for my beginner Tableau needs, allowing me to smoothly build on knowledge gained from the previous tutorial subset.
Jose
November 30, 2023
This course was very helpful, the information shared by the speaker is very complete and makes the subject easy to understand.
Antwuan
November 29, 2023
As I am on my Data Analyst journey, learning and becoming proficient in Tableau is my next goal to accomplish.
Jeff
November 26, 2023
Great course. Taught me everything I need to know to feel very competent to take on beginner to advanced Tableau projects
Steven
November 16, 2023
There are a few important sections that are out of date. Unions and Joins on 2023 Version is quite different from when this was made, that section was no help. Tableau could not access some resources and gave error messages. This course needs a little TLC for it to be helpful in 2023. I did learn the basics though but for the tougher parts this course does not suffice.
Diego
November 16, 2023
The course and the instructor are great. However, there is room for improvement, since in some parts instructor go too fast, specially for someone with 0 experience with this type of analytical tools. Also, i struggled a lot using the csv files. But course is very useful.
Benny
November 2, 2023
Well done! The cours is will explainde, somtimes the lecturer spoke too fast but in general I received a lot of information, and I feel comfortable going trough with Tableau. Thank you, Rayan.

Charts

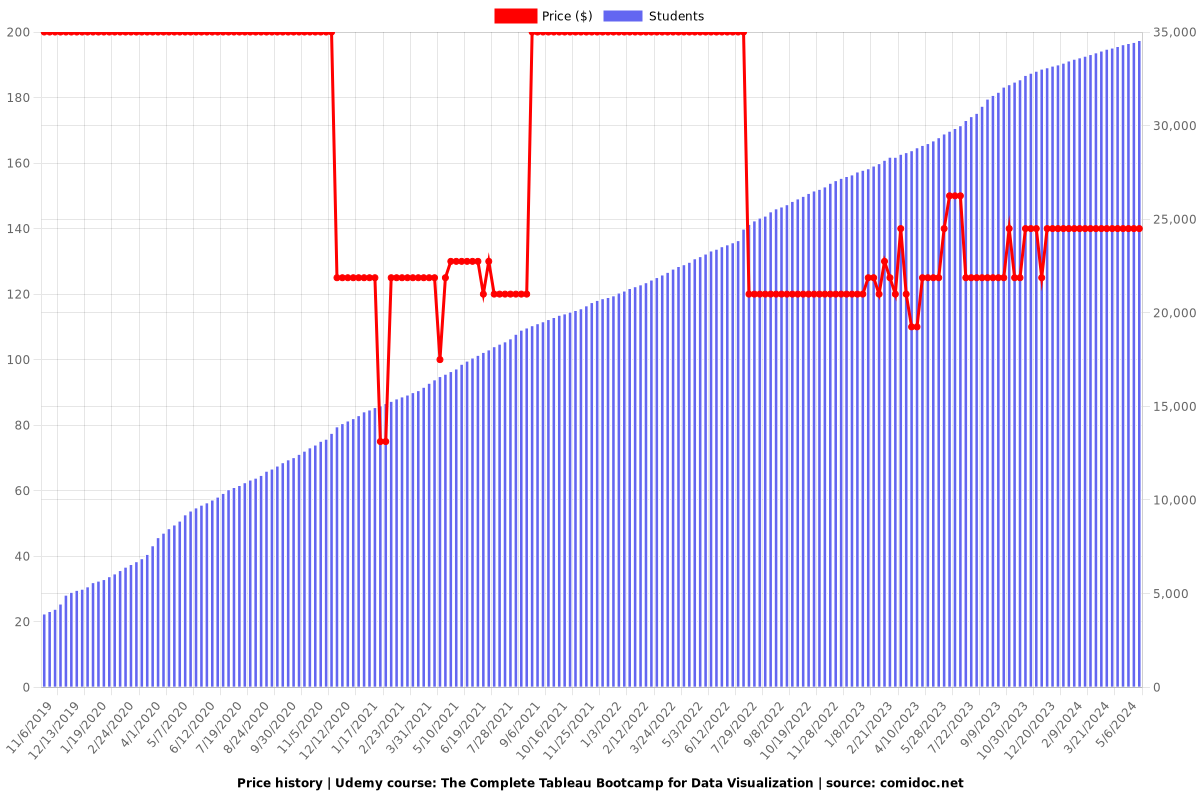
Price

The Complete Tableau Bootcamp for Data Visualization - Price chart

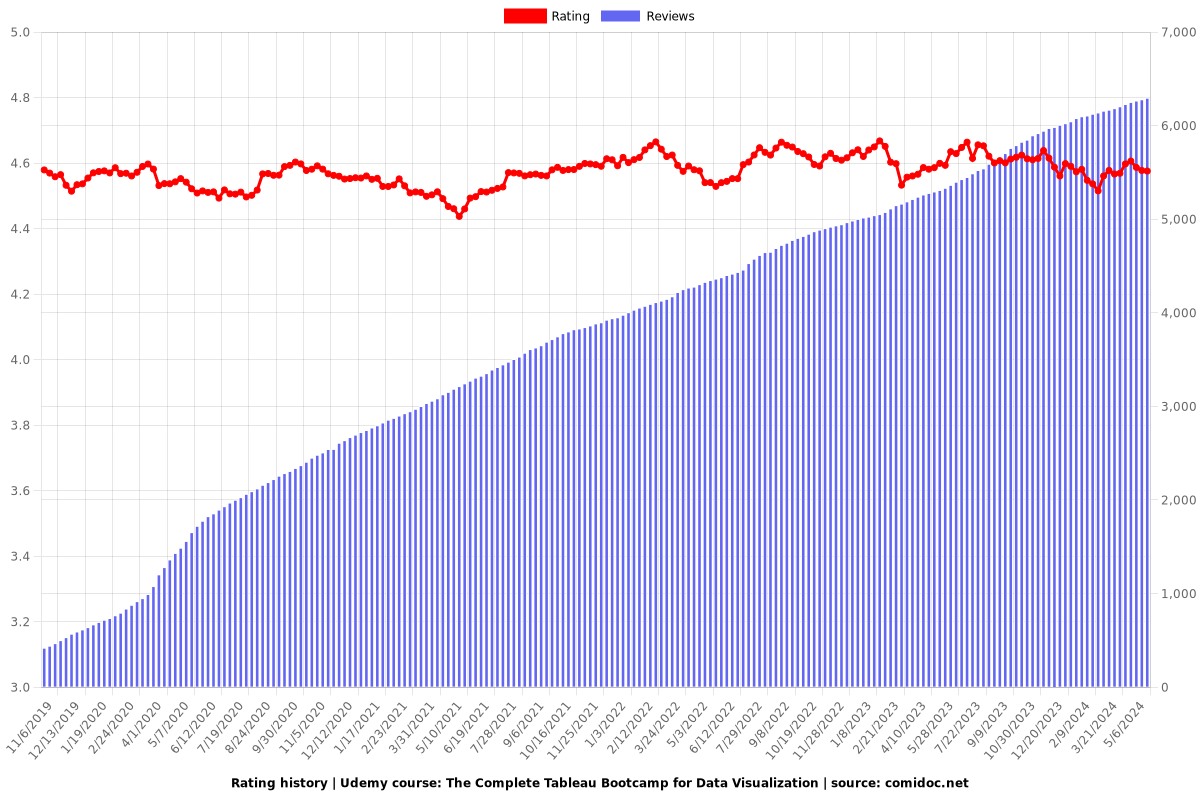
Rating

The Complete Tableau Bootcamp for Data Visualization - Ratings chart

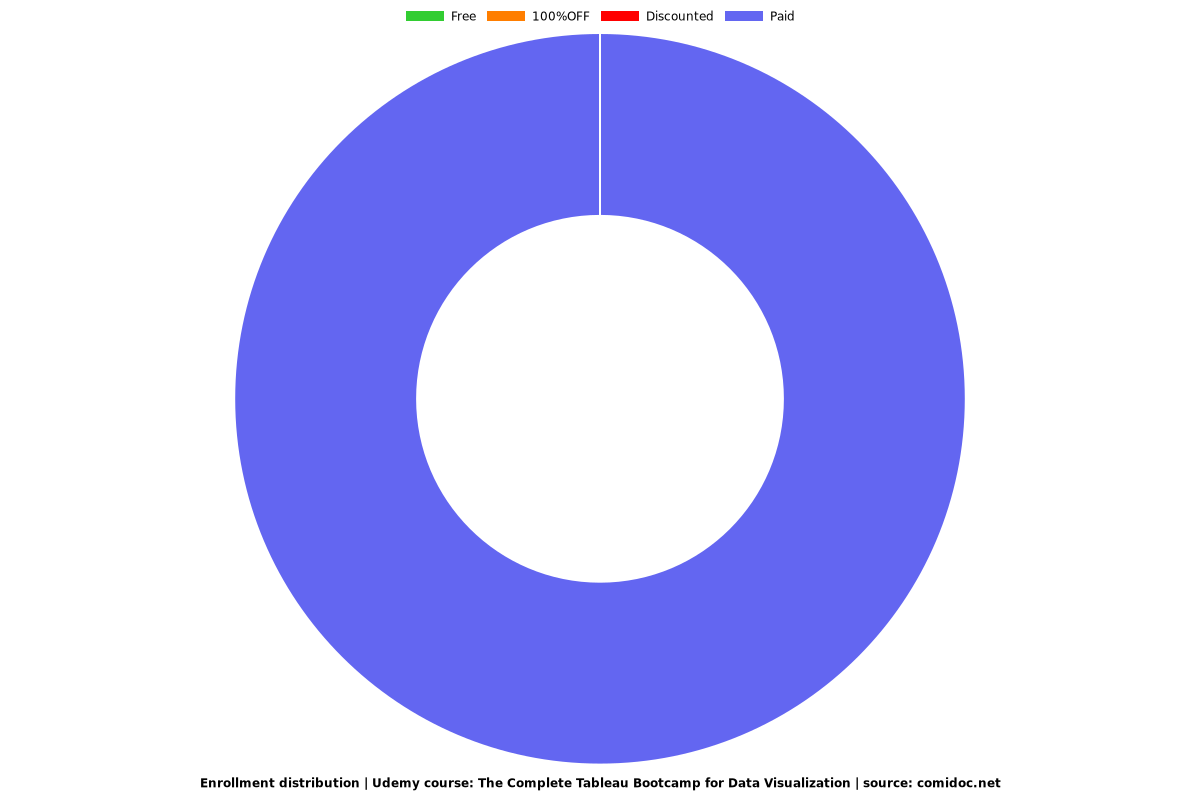
Enrollment distribution

The Complete Tableau Bootcamp for Data Visualization - Distribution chart

Related Topics

2382715
udemy ID
5/24/2019
course created date
11/6/2019
course indexed date
Bot
course submited by