Covid 19 analytics with live open data and R in 1 day
One day course to turbo boost your analytics projects using open data sources and geospatial information
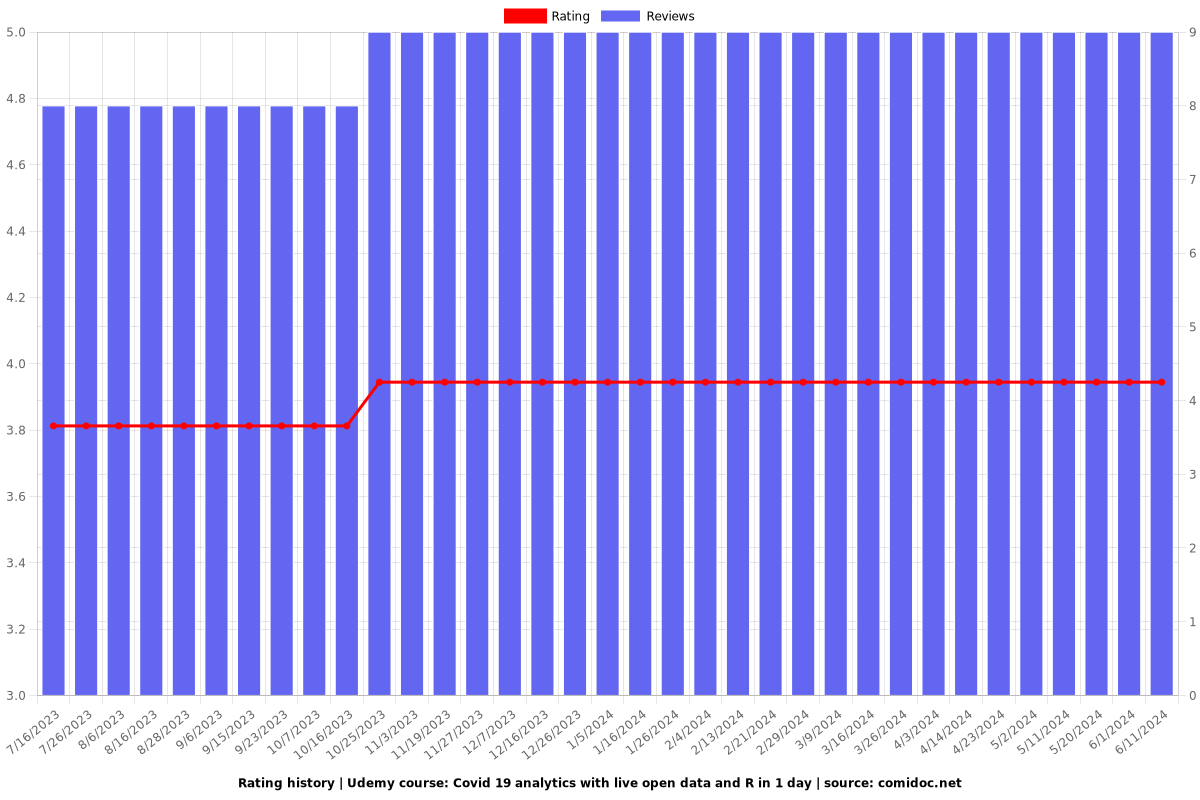
3.94 (9 reviews)

43
students
2.5 hours
content
Apr 2021
last update
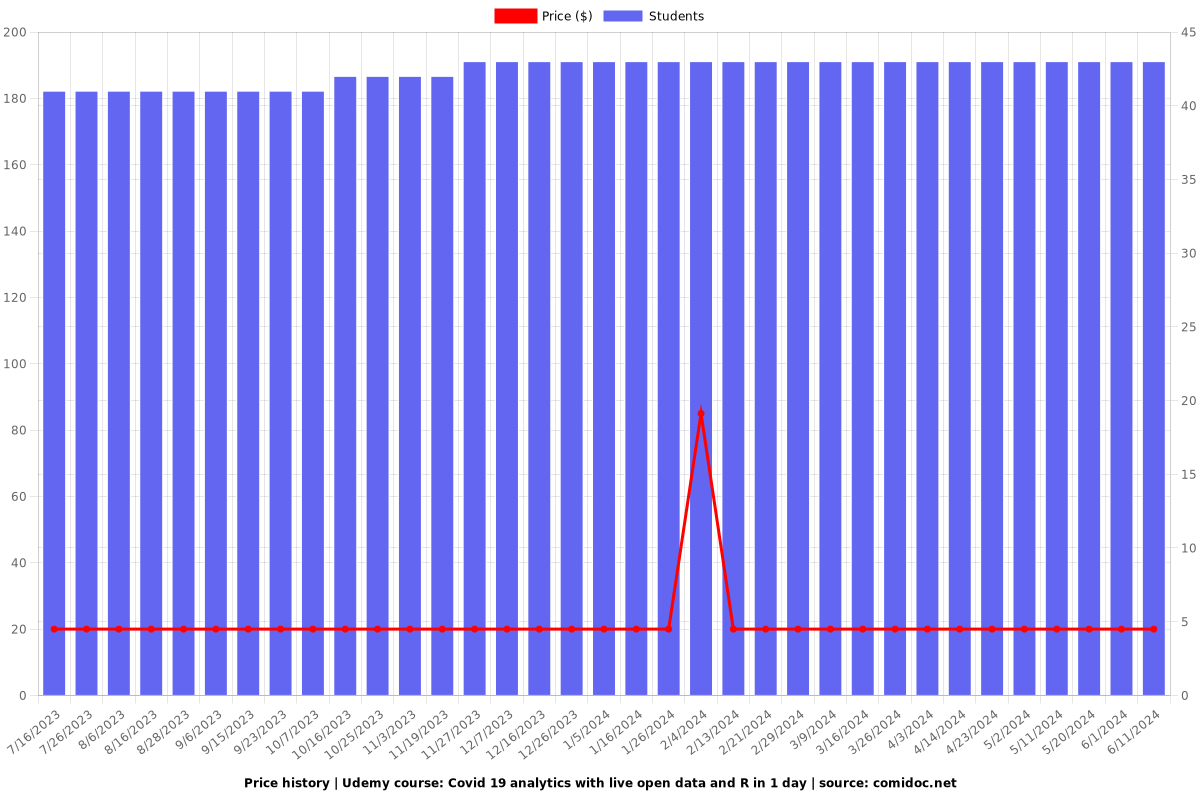
$19.99
regular price
What you will learn
Get the data: retrieve latest Covid-19 data for Countries and regions
Understand, analyse and wrangle data using R (free software)
Create animations and movies to share insights using R
Great analytics project for Data analysts, Epidemiologists, Biostatisticians, and Data Scientists
Use ggplot and plotly packages to generate lively visualizations
Rmarkdown /KnitR for dynamically creating and sharing reports
Why take this course?
🌐 **Course Title:** Covid 19 Analytics with Live Open Data and R in 1 Day
🚀 **Course Headline:** One Day Course to Turbo Boost Your Analytics Projects Using Open Data Sources and Geospatial Information
🔥 **Course Description by Sanjeev Baniwal, Ph.D.**
Get ready to unlock the power of open data and geospatial analytics with just **ONE DAY** of intensive learning! In this comprehensive course, I will guide you through the process of accessing valuable Covid-19 related datasets and mastering them using R – all within a single day. This is your chance to become an analytics wizard, creating insights from real-world data that can inform decisions and policy-making.
**What You'll Learn:**
- **Data Procurement:** I'll show you where to find high-quality, open data sources related to Covid-19 and how to access them through various APIs.
- **Data Analysis with R:** Learn to manipulate and analyze your newly acquired data using R – a powerful tool that's both free and widely used in the data science community.
- **Visualization Techniques:** Discover how to create impactful visualizations using R's ggplot2 library. We'll cover everything from scatter plots and bar charts to advanced dynamic time lapse visualizations.
- **Geospatial Analysis:** Explore the Covid-19 data across different geographic areas, including countries, states, and counties, to understand the spread and impact of the pandemic at various scales.
**Course Highlights:**
- **Step-by-Step Guidance:** No prior experience with R or data analysis? No problem! I'll provide step-by-step instructions for each process, ensuring you can follow along easily.
- **Hands-On Learning:** You'll work directly with real data and practice creating visualizations that are both informative and visually appealing.
- **Tailored for Your Projects:** The skills you learn in this course are not just for one-off analyses; they are entirely adaptable to future analytics projects of your choosing.
- **Maximize Your Data's Value:** By the end of this course, you'll know how to extract maximum value from the data you analyze, saving you time and effort in the long run.
**What You'll Need:**
- A computer with internet access to procure and work with open data sources.
- Basic familiarity with R or a willingness to learn (don't worry if you're a beginner!).
**Why This Course?**
In an era where data-driven decision-making is crucial, understanding how to harness the power of open data and analytics tools is invaluable. Whether you're a student, researcher, healthcare professional, or anyone interested in the intersection of technology and health, this course will equip you with the skills needed to make sense of the vast amounts of data available today.
Join me on this one-day analytics adventure and emerge ready to tackle complex data challenges with confidence! 📊🚀
Enroll now and transform your approach to data analysis forever!
Screenshots


Reviews
Lalantha
November 18, 2021
No response to questions. When learning code, like R, you can be slipped up on simple things, that need a simple explanation. That was not happening on this course. Also, teh explanations are muddled. with not clear instructions.
Rüdiger
March 31, 2021
Thank you Sanjeev, you present a solid work (i am now on lesson 9). I haven't heard about the covid-19-data hub. Thank you a lot. From the point of view R and covid19 data you are an expert!
Sanya
March 18, 2021
The instructor started with basics and gradually explained pretty sophisticated techniques....watch with 1.25x speed :)
Charts
Price
Rating
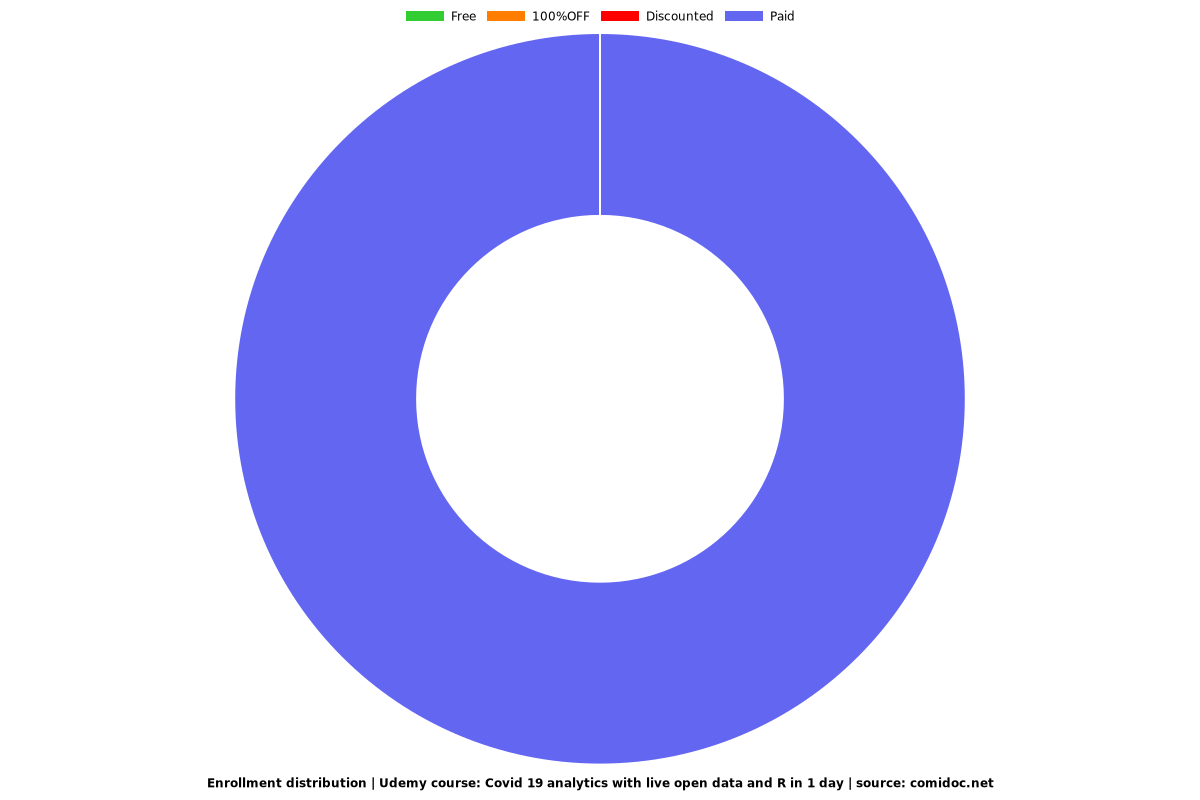
Enrollment distribution
Related Topics
3211767
udemy ID
6/7/2020
course created date
7/16/2023
course indexed date
Bot
course submited by