Data Visualization in JavaScript with React and D3.js
Build beautiful data visualizations and visualization tools with JavaScript
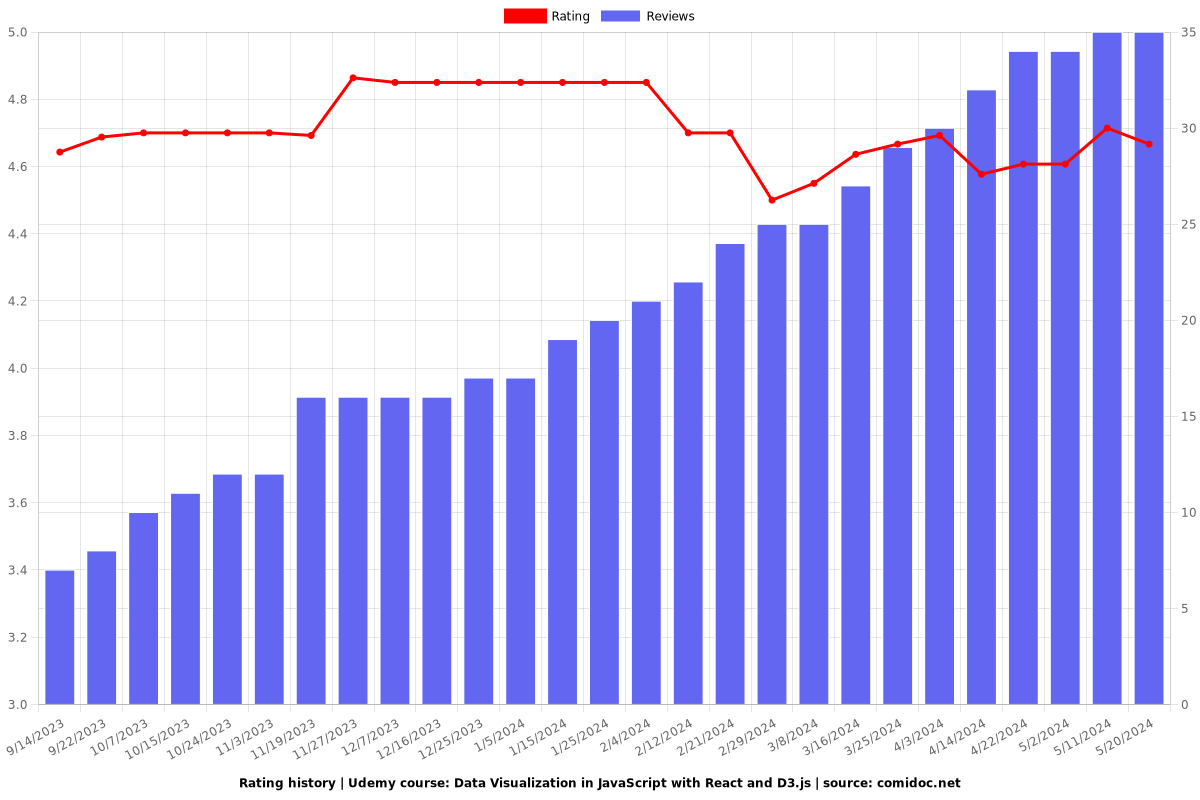
4.67 (35 reviews)

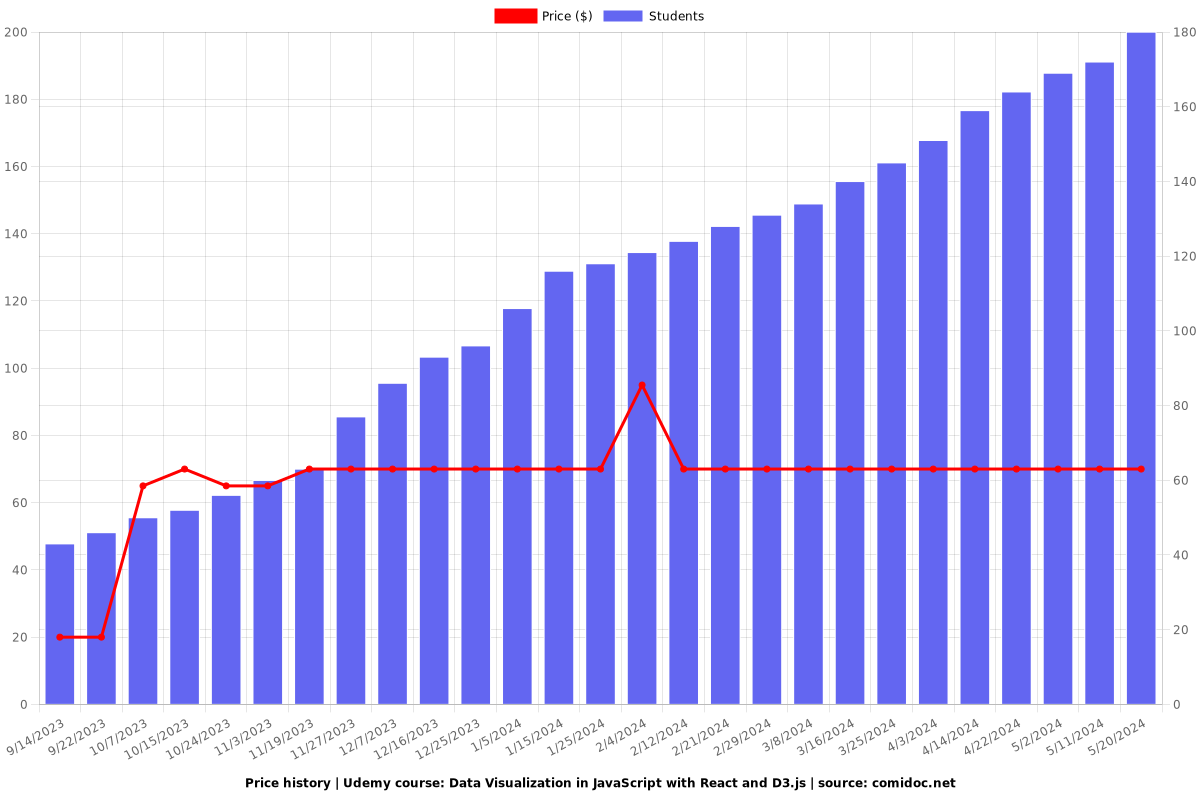
180
students
3 hours
content
May 2023
last update
$69.99
regular price
What you will learn
Gain proficiency with two of the premier javascript libraries for data visualization
Understand the challenges of integrating React and D3 and how to overcome c
Build a fully interactive data visualization in D3 and React
Understand how to add fluid transitions and animations to charts
Why take this course?
🎉 **Course Title:** Data Visualization in JavaScript with React and D3.js
🚀 **Headline:** Build Beautiful Data Visualizations and Visualization Tools with JavaScript!
---
**Unlock the Power of Data: Master Data Visualization with React and D3.js!**
Data visualization is a critical skill for anyone working in data science, software development, or any field that requires analyzing and presenting data. This comprehensive online course will empower you to create stunning, interactive data visualizations using JavaScript, React, and D3.js – some of the most sought-after skills in the tech industry today! 📊✨
**What You'll Learn:**
- **The Art of Data Storytelling:** Learn how to tell compelling stories with your data, making complex datasets understandable and engaging for any audience.
- **Responsive and Performant Visuals:** Produce visualizations that not only look great but are also fast and responsive to user interactions, ensuring a smooth user experience.
- **Real-World Applications:** From business intelligence dashboards to dynamic data-driven graphics, gain the skills to tackle various data visualization challenges.
**Course Highlights:**
- **Hands-On Learning:** Dive into practical examples and real-world scenarios, applying your JavaScript knowledge directly to creating data visualizations.
- **Modern Stack Mastery:** Get up to speed with React (v17) and D3.js (v7), the tools that lead the way in modern web development for data visualization.
- **Balanced Approach Teaching:** Learn different methodologies for integrating React and D3, understanding their tradeoffs, and choosing the best approach for your projects.
**Prerequisites:**
- **Familiarity with React and D3:** Some prior knowledge of using React and D3 separately is recommended. We'll review key concepts and provide plenty of examples to get you up to speed if needed.
- **Basic JavaScript Skills:** A grasp of fundamental JavaScript will be beneficial for following along and completing the course projects.
**Course Structure:**
Introduction: Explore why learning React and D3 is essential for your data visualization toolkit.
- Why learn React and D3?
Part 1: D3 Basics Review: Get a grip on the foundational aspects of D3 that will form the basis of your visualizations.
- Binding data to the DOM using D3
- Adding data and styling it in D3
Part 2: A Declarative Approach to React and D3 Integration: Learn how to translate D3's imperative commands into React's declarative style.
- Translating D3 syntax into JSX
- Pros and cons of this approach
Part 3: A Hybrid Approach to React and D3 Integration: Find the perfect balance between React and D3 for dynamic and responsive visualizations.
- Balancing D3's transition capabilities with DOM updates and React's render cycle
- Build a fully functioning scatterplot that updates with new data
Part 4: Practical Project - Gapminder Scatterplot: Put all your skills to the test by building an interactive data visualization.
- Create a fully interactive data visualization of the popular gapminder dataset
- Add user-defined filters and other controls
- Bring all your knowledge together to create a fully immersive chart for business use cases or publication
---
**Ready to Transform Data into Stories? Enroll Now and Elevate Your Career with Advanced Data Visualization Skills! 🌐🎓**
Screenshots


Charts
Price
Rating
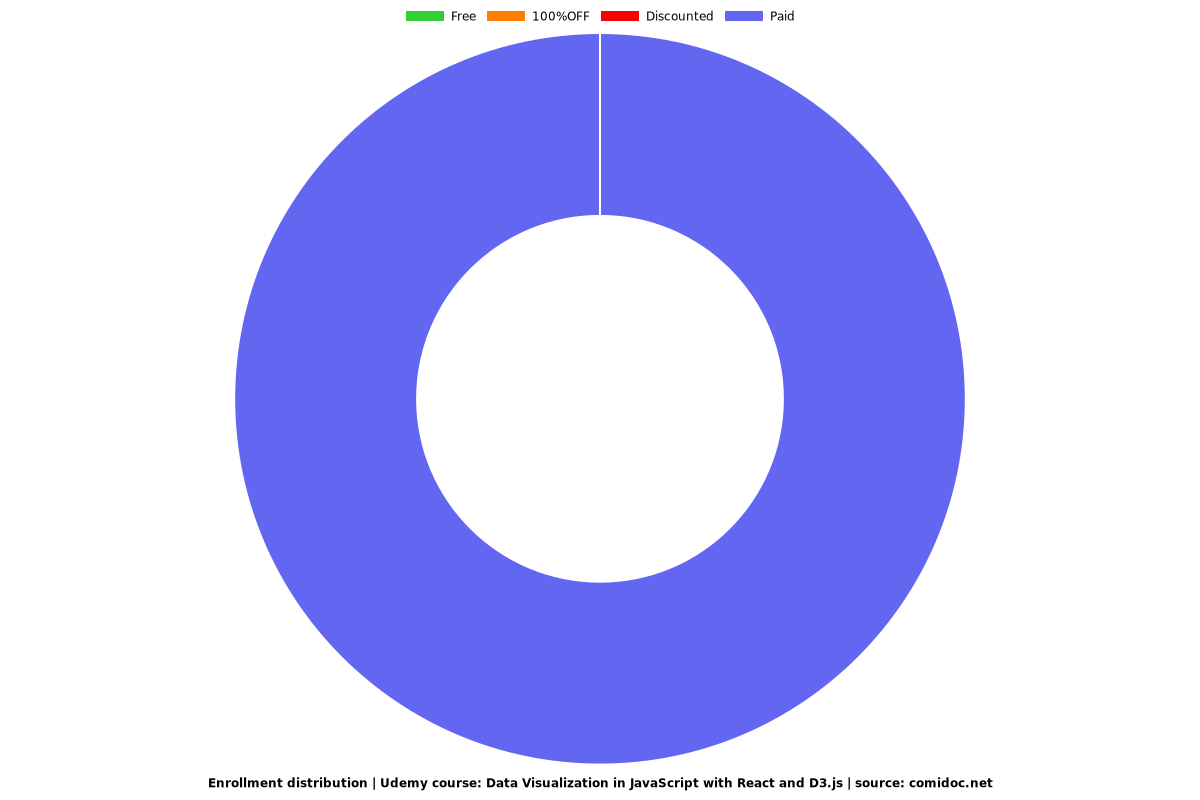
Enrollment distribution
Related Topics
5192454
udemy ID
3/4/2023
course created date
9/14/2023
course indexed date
Bot
course submited by