Interactive Python Dashboards with Plotly and Dash

Learn how to create interactive plots and intelligent dashboards with Plotly, Python, and the Dash library!

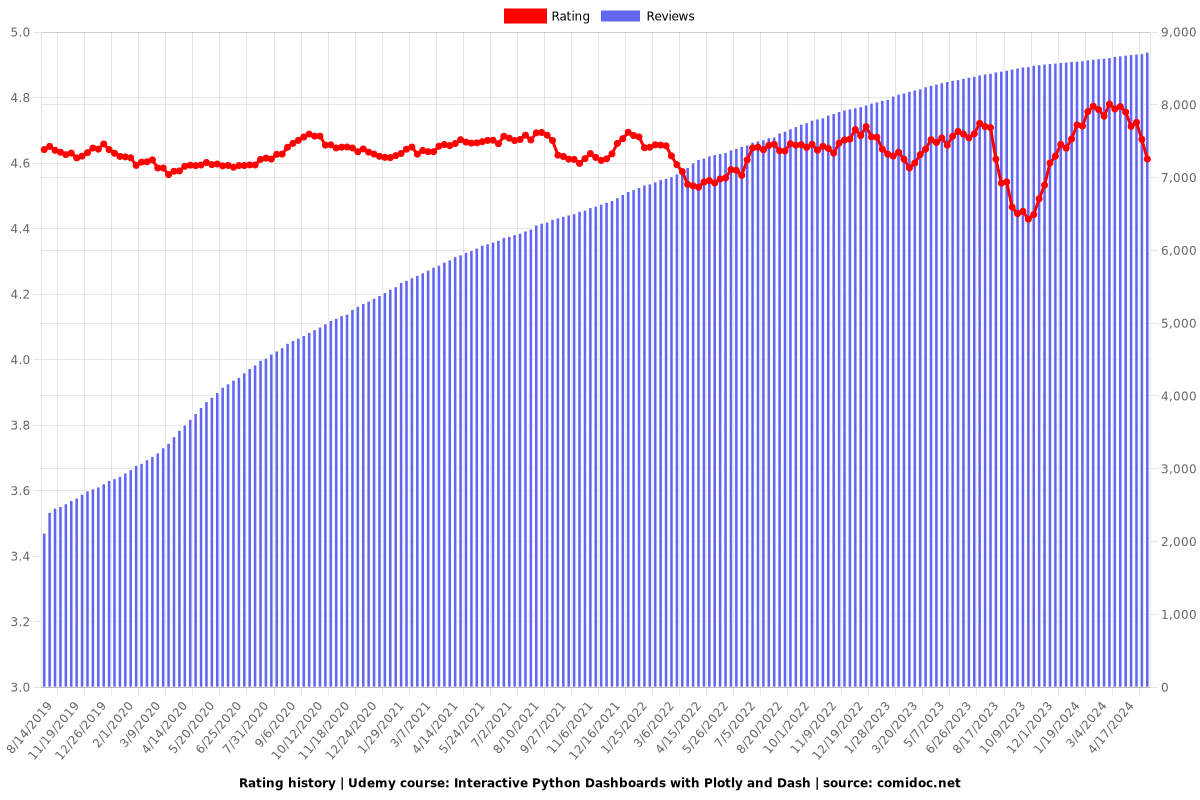
4.72 (8700 reviews)
Udemy
platform
English
language
Data Science
category
instructor
Interactive Python Dashboards with Plotly and Dash
47,999
students
9.5 hours
content
Sep 2019
last update
$129.99
regular price

What you will learn

Learn about Plotly to create plots like Bar Charts, Line Charts, Scatter Plots, Heat Maps, and more!

Create Layouts with Plotly's Dash library.

Use Dash to create interactive components with Plotly.

Learn how to connect multiple inputs and outputs with a dashboard.

Update live interactive graphs with clicks, hover overs, and more.

Connect the interactive dashboard to live updating data for streaming information.

Learn how to secure your interactive dashboards with App Authorization.

Deploy your interactive dashboards to the internet with services like Heroku.

Why take this course?

Welcome to Python Visualization Dashboards with Plotly's Dash Library!

This course will teach your everything you need to know to use Python to create interactive dashboard's with Plotly's new Dash library! Have you ever wanted to take your Python skills to the next level in data visualization? With this course you will be able to create fully customization, interactive dashboards with the open source libraries of Plotly and Dash.

Dash instructional courses from Plotly usually cost more than $1000, but now you can get the bootcamp experience for a fraction of that price in this self-paced course that includes example code, explanatory videos, student support in our chat channels, Question and Answer Forums, and interactive exercises.

We'll start off by teaching you enough Numpy and Pandas that you feel comfortable working and generating data in our quick crash course. Then we'll continue by teaching you about basic data visualization with Plotly, including scatter plots, line charts, bar charts, bubble charts, box plots, histograms, distribution plots, heat maps, and more! We'll also give you an intuition of when to use each plot type.

After this and at the end of each section you'll be given exercise tasks to test and evaluate your new skills, a feature no other Plotly Dash training offers!

Once you have a grasp on Plotly basics we'll move on to the bulk of the course which is utilizing the Dash library to leverage the power of plotly plots to create interactive dashboards. We'll discuss how to create layouts for dashboards, how to have interactive callbacks, dealing with multiple inputs and outputs, creating interactive components, and more!

We'll finish off the course by going over live updating dashboards that automatically update in real time and even show you how you can deploy your dashboards live to the web with the Heroku service.

By taking this course you will be learning the bleeding edge of data visualization technology with Python and gain a valuable new skill to show your colleagues or potential employers. After completing the course you will have a certification you can post to your LinkedIn profile and a portfolio of dashboard projects you can share as well.

All of this comes with a 30 day money back guarantee, so what are you waiting for? Enroll today and we'll see you inside the course!

Screenshots
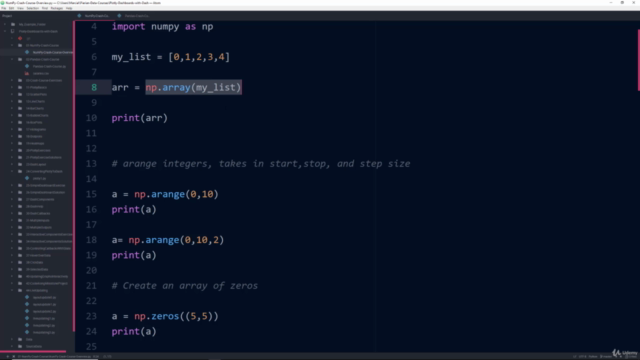
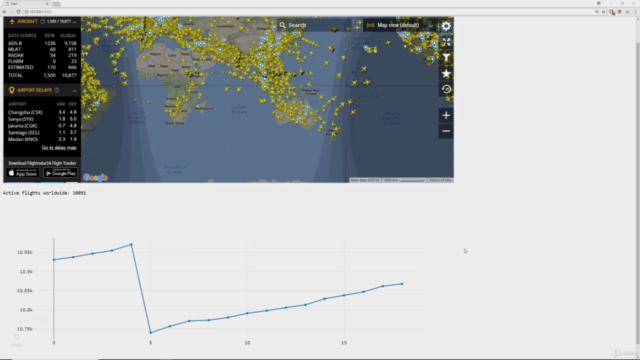
Interactive Python Dashboards with Plotly and Dash - Screenshot_01Interactive Python Dashboards with Plotly and Dash - Screenshot_02Interactive Python Dashboards with Plotly and Dash - Screenshot_03Interactive Python Dashboards with Plotly and Dash - Screenshot_04

Our review

🌟 **Course Overview:** The course in question offers a comprehensive introduction to creating interactive data visualizations and dashboards using Plotly and Dash, two powerful libraries in the Python ecosystem. Students can expect a detailed, step-by-step guide through the fundamentals of these tools, culminating in the ability to build robust data visualization applications. **Pros:** - **Content Quality:** The course content is described as "really good" and "very good," with clear and informative lectures that provide great value for learners. - **Practical Application:** The instruction is hands-on and practical, allowing students to actively engage with the material and apply what they've learned in real-world scenarios. - **Instructor Expertise:** Jose, the instructor, is highly regarded by students, who appreciate his well-designed courses and clear communication style. - **Useful for Various Levels:** The course is beneficial for beginners looking to start with data visualization and dashboards as well as experienced coders seeking to expand their skillset. - **Clear Explanations:** Lectures are said to be succinct but illustrative, with practical suggestions that are particularly appreciated by experienced coders. **Cons:** - **Outdated Content:** A recurring issue in reviews is the course's outdated content, with some students encountering deprecated features and struggling to get recent libraries to work. - **Lack of Updates:** Some learners suggest that the course has not been updated to reflect new developments in Plotly and Dash, leading to confusion and additional effort to stay current. - **Insufficient Depth on Complexities:** While the course provides a solid foundation, it is criticized for not delving deeply into more complex aspects such as multi-screen dashboards or real-life application integration. - **Incomplete Coverage:** There are instances where the course falls short of covering all necessary material, requiring students to refer to external documentation for additional functionalities. - **Question and Answer Inefficiency:** The Q/A section in the course is noted to be lacking, with no responses evident for any questions posed by learners. - **Inconsistent Coding Practices:** Some students find that the instructor's coding style, which often breaks PEP8 guidelines, can be jarring and potentially misleading. - **Outdated Software References:** Tools like Atom, referenced in the course, are no longer available for download, necessitating updates to the course material for relevance. - **Lack of Assessments:** The absence of exams or practical assessments throughout the course raises concerns about the retention and application of knowledge. **Course Recommendations:** To enhance the learning experience and address the cons, it is recommended that the following updates and improvements be made: 1. **Content Updates:** Regularly update the course to include the latest libraries, syntax, and best practices for Plotly and Dash. 2. **Q&A Support:** Ensure that the Q/A section is active and responsive to student inquiries. 3. **Practical Assessments:** Incorporate quizzes or projects at various points in the course to reinforce learning and assess comprehension. 4. **Coding Standards:** Adhere to coding standards such as PEP8 to maintain consistency and avoid confusion. 5. **Software References:** Update any outdated software references to ensure all tools and environments used in the course are current and available. 6. **Advanced Topics:** Expand on more complex aspects of Plotly and Dash, including advanced features like multi-screen dashboards and deployment. By addressing these areas, the course can provide a more robust and up-to-date learning experience that better serves its students' needs.

Charts

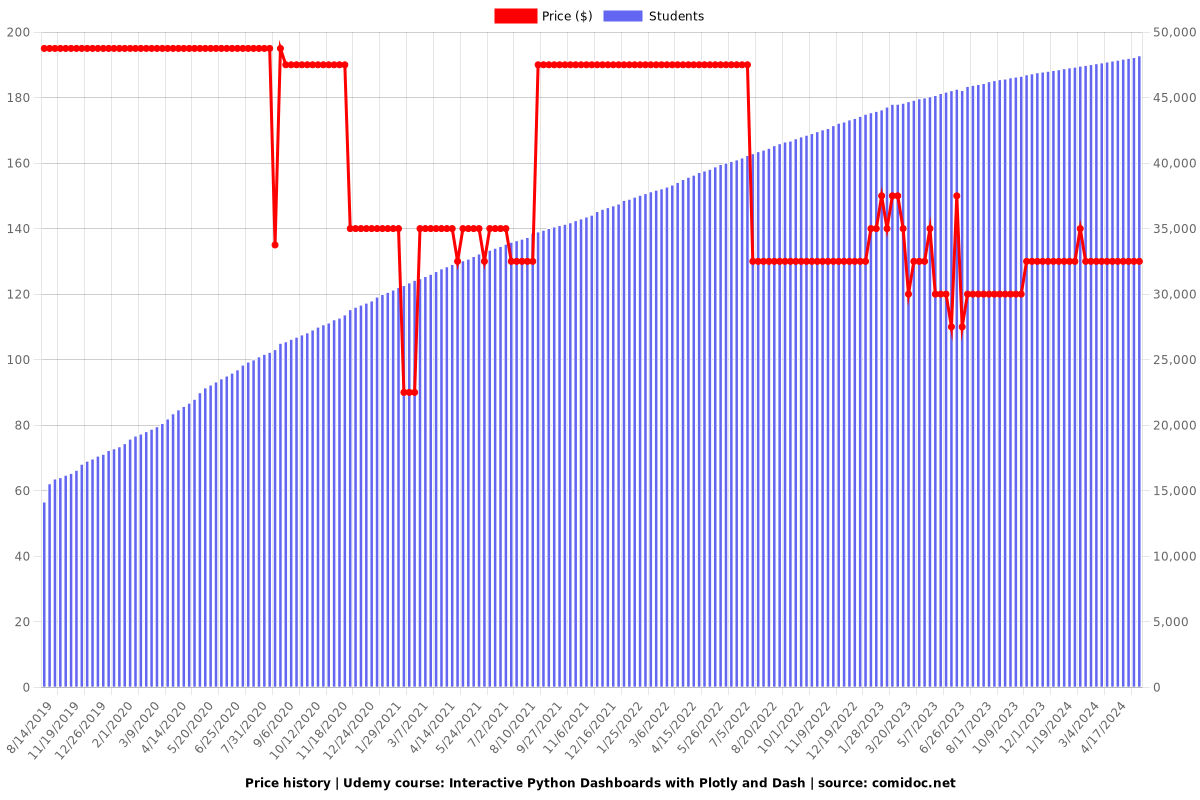
Price

Interactive Python Dashboards with Plotly and Dash - Price chart

Rating

Interactive Python Dashboards with Plotly and Dash - Ratings chart

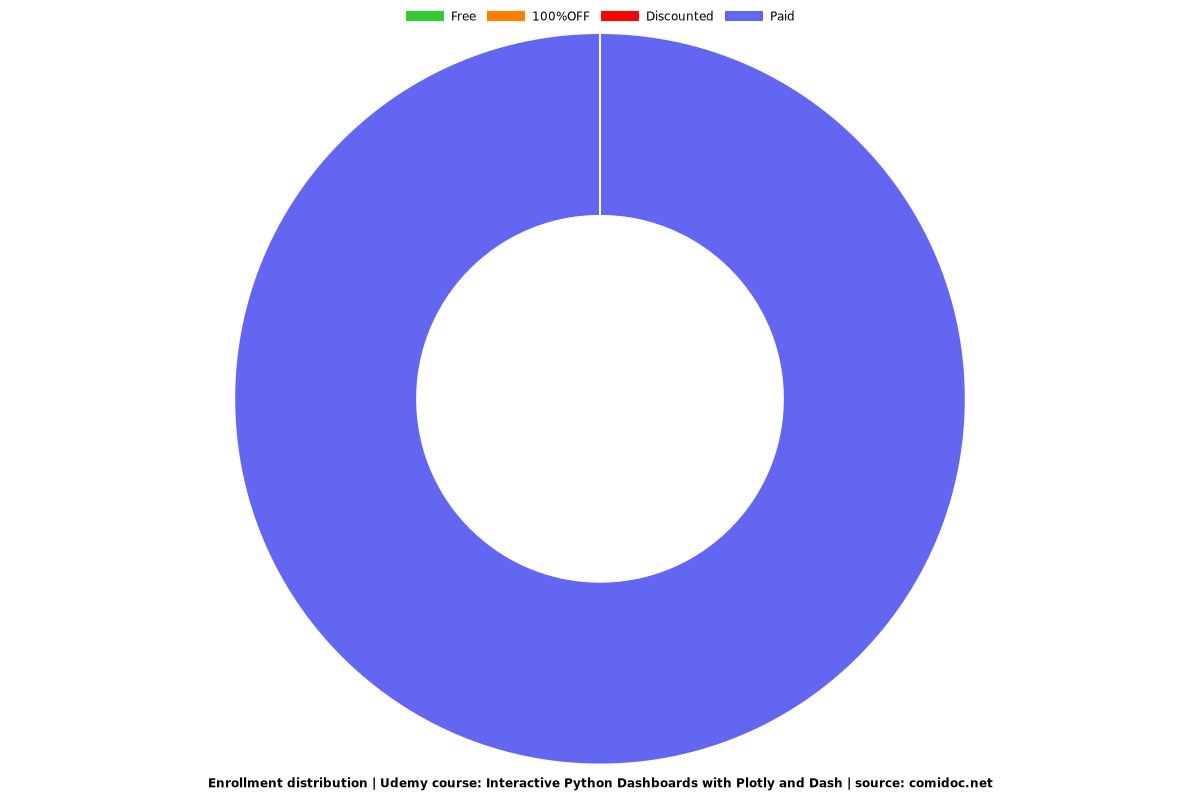
Enrollment distribution

Interactive Python Dashboards with Plotly and Dash - Distribution chart

Related Topics

1575562
udemy ID
3/1/2018
course created date
8/14/2019
course indexed date
Bot
course submited by