Learning Python for Data Analysis and Visualization Ver 1
Learn python and how to use it to analyze,visualize and present data. Includes tons of sample code and hours of video!
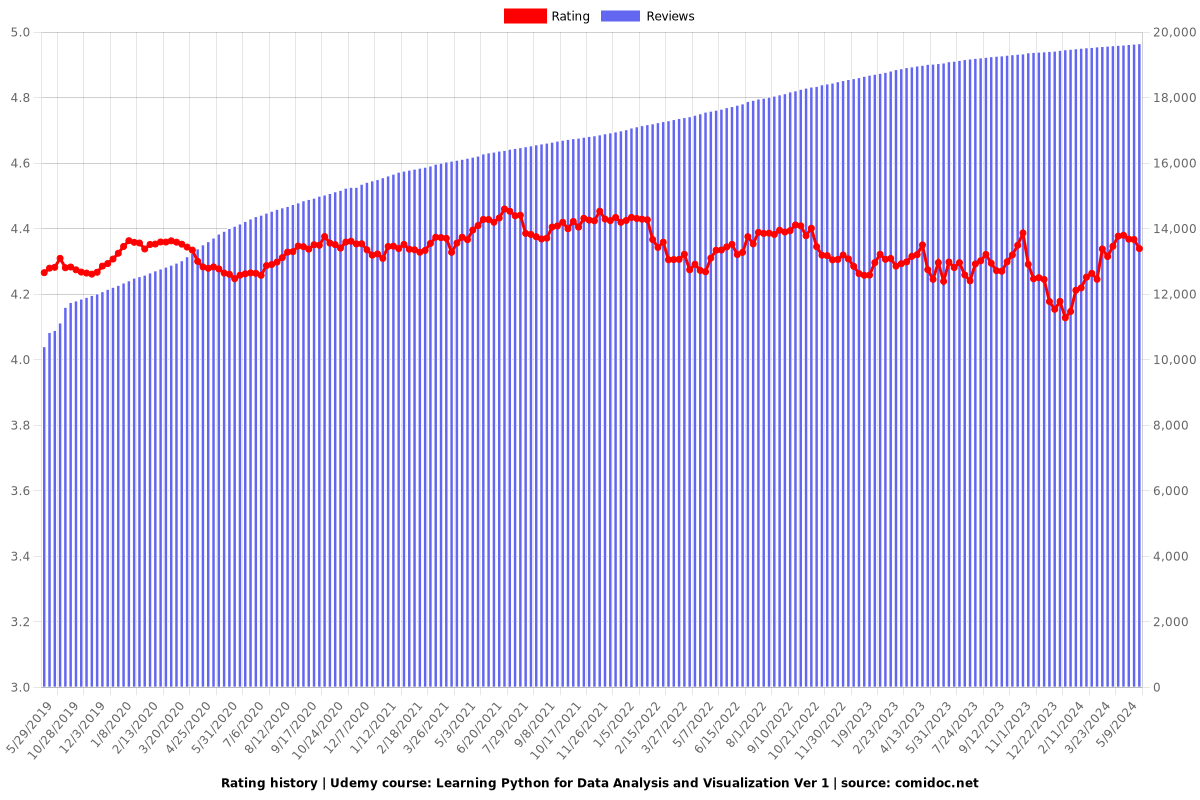
4.37 (19624 reviews)

201,570
students
21 hours
content
Sep 2019
last update
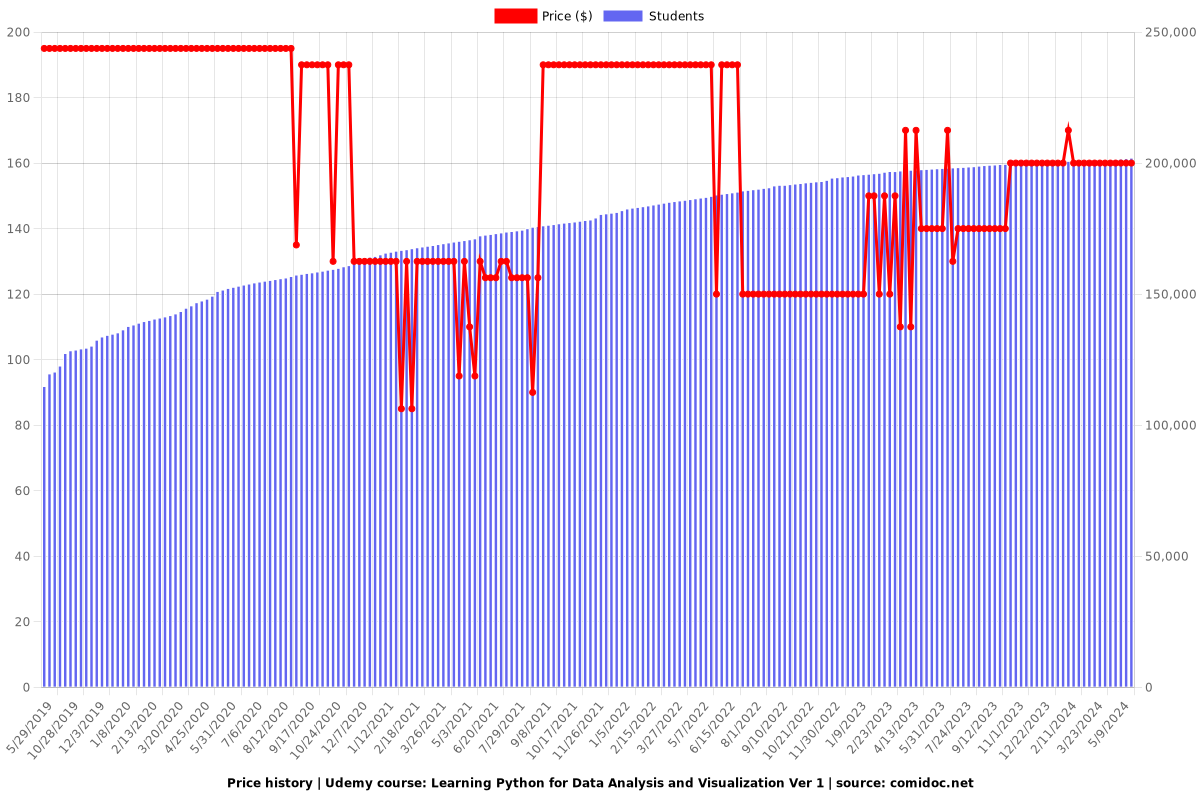
$159.99
regular price
What you will learn
Have an intermediate skill level of Python programming.
Use the Jupyter Notebook Environment.
Use the numpy library to create and manipulate arrays.
Use the pandas module with Python to create and structure data.
Learn how to work with various data formats within python, including: JSON,HTML, and MS Excel Worksheets.
Create data visualizations using matplotlib and the seaborn modules with python.
Have a portfolio of various data analysis projects.
Why take this course?
🚀 **Course Title:** Learning Python for Data Analysis and Visualization Ver 1
🎓 **Headline:** Dive into the World of Data with Python! 📊✨
---
**Course Description:**
Unlock the Power of Python in Data Science!
Are you ready to embark on an exciting journey into the realm of data analysis and visualization using Python? Whether you're a complete beginner or looking to sharpen your skills, this comprehensive course is tailored to take you from a novice to a proficient Python programmer, with a focus on handling and interpreting data.
**What You'll Learn:**
- 🤖 **Python Programming Fundamentals:** Grip the basics of Python and understand its syntax and structure to build a strong coding foundation.
- 📊 **Data Manipulation with Numpy & Pandas:** Master the art of creating and manipulating arrays and data frames using powerful libraries like NumPy and Pandas, enabling you to handle large datasets efficiently.
- 📈 **Data Visualization Techniques:** Learn to craft compelling visualizations using Matplotlib and Seaborn libraries, turning complex datasets into insightful graphs and charts that tell a story.
- 🧠 **Machine Learning with SciKit Learn:** Get an introduction to the basics of machine learning and learn how Python can be used to make predictions and build models using SciKit Learn.
**Your Course Includes:**
- **Extensive Video Content:** Hours of engaging video lectures that walk you through each topic with clarity and depth.
- **100+ Example Code Notebooks:** Access a vast collection of code examples across various projects, which you can use to build your data analysis portfolio.
- **Project-Based Learning:** Work on real-world data analysis projects that will prepare you for practical challenges in the field.
- **Lifetime Access & Updates:** Enjoy lifetime access to all course materials, including new and updated videos and future project additions.
**By the End of This Course, You Will Be Able To:**
- Program confidently in Python, understanding its core concepts and practical applications.
- Create, manipulate, and analyze data sets with numpy and pandas.
- Generate captivating visualizations to represent your findings.
- Develop a portfolio of python data analysis projects, showcasing your skills to potential employers.
- Apply basic machine learning concepts using SciKit Learn.
**Why Choose This Course?**
With over 100 lectures and more than 20 hours of content, this course is designed to provide you with a comprehensive understanding of Python for data analysis and visualization. It's not just about the code; it's about understanding how to think like a data scientist.
Whether you're aiming for a career transition into data science or looking to add valuable skills to your current role, this course is the perfect stepping stone. 🌟
---
**Enroll Now and Transform Your Data Skills with Python!**
Remember to review all course details to ensure this version aligns with your learning goals. Welcome to the data revolution with Python at your fingertips! 🚀💻
Screenshots


Our review
👩🏫 **Global Course Rating:** 4.35
Based on recent reviews, the course has garnered a diverse set of feedback, indicating both its strengths and areas for improvement. Here's a breakdown of the course's aspects as reflected in the reviews:
### Pros:
- **Comprehensive Content:** Many reviewers found the content extensive and comprehensive, particularly regarding pandas, numpy, and plotting. The instructor's explanations were clear and facilitated understanding of fundamental concepts effectively.
- **Solid Foundation:** Despite being created in 2015, several users reported that the course provided a solid foundation in data manipulation and visualization tools, which are still relevant today.
- **Instructor's Summary:** The teacher was praised for providing nice summaries that helped to wrap up lessons effectively.
- **Early Lessons:** Early lessons were highlighted as very good by some users, indicating strong starting content.
- **Good Introduction:** The course was described as a very good class for beginners looking to get comfortable with programming code and the Python language.
- **Value for Data Analyst Position:** Some reviewers found the course helpful as a starting point for those aiming for a Data Analyst position, praising its videos for being simple, exact, and concise.
### Cons:
- **Outdated Material:** A significant number of reviews pointed out that the material is outdated. The course doesn't reflect current Python versions, and some functions and datasets used in the course have since been deprecated or are no longer available.
- **Lack of Updates:** The course has not been updated to reflect changes in Python or data science fields, leading to confusion and additional work for users trying to follow along with the latest versions.
- **Flow and Organization:** There were complaints about the flow of the course and the way modules are presented. Some users preferred a longer form video presentation over short, modular videos.
- **Dataset Relevance:** The datasets used in the course may not be available or relevant today, and some reviewers suggested that the course should include datasets that perform all commands, leaving a meaningful practice notebook behind.
- **Deprecated Functions and Datasets:** Several users reported issues with datasets from videos no longer existing and functions taught in the course being deprecated. This required them to spend more time searching for workarounds or solutions in the Q&A section.
- **Confusing Installation Process:** There were mixed experiences with downloading and installing necessary software like Anaconda, Python, and Jupyter, which some found confusing.
- **Lack of Clarity on Course Version:** A few reviewers expressed frustration over the lack of clarity about the course version they were enrolling in, particularly when expecting an updated version based on other courses from the same instructor.
### Recommendations for Improvement:
- **Update Content:** The course should be updated to reflect the latest versions of Python and data science practices.
- **Notify Learners:** It is recommended that potential learners are clearly informed about the course's version and whether it is the current or an older one.
- **Improve Dataset Usage:** Implementing datasets in a way that ensures they are up-to-date and relevant could greatly enhance the learning experience.
- **Longer Form Video Presentation:** Consider adopting a longer form video presentation style, which may provide a clearer learning path for users.
- **Clearer Instructions:** Improve instructions for downloading and installing necessary software to ensure a smoother start for learners.
In conclusion, while the course offers valuable content for understanding pandas, numpy, and plotting in Python, it is crucial for future students to be aware of its outdated nature and the effort required to adapt to current standards. A significant update to the course material would greatly improve the learning experience and benefit users looking to advance their knowledge in data science and machine learning with Python.
Charts
Price
Rating
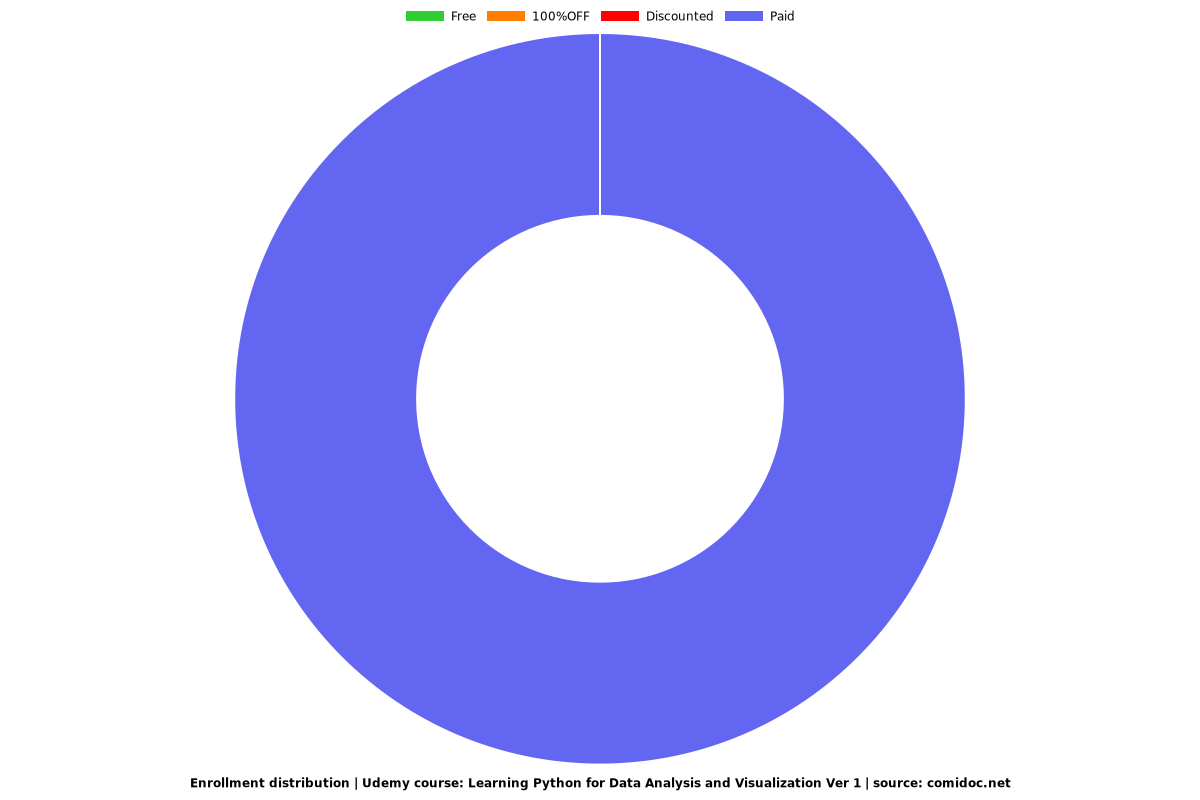
Enrollment distribution
Related Topics
396876
udemy ID
1/18/2015
course created date
5/29/2019
course indexed date
Bot
course submited by